

In the ever-evolving world of social media, TikTok stands out as a whirlwind of creativity, trends, and sheer velocity. But here lies both the beauty and the challenge.
With its rapid-fire content and millions of active users, TikTok churns out a staggering volume of data at an unprecedented pace. As the content never sleeps, making it a captivating stage for creators and businesses alike, the metrics and data generated are almost overwhelming to track effectively.
Let's address the problem at hand
As per research by Flamingo, TikTok now has the potential to inspire, influence, and impact action far beyond the platform, benefitting brands, lifestyle, culture, and the community alike! So, there is no doubt that the data the platform generates has a wealth of opportunities for organizations to gain actionable insights.
Here's why social listening is increasingly important for Tiktok.
However, significant challenges emerge as the volume of data and the number of metrics continue to surge. The sheer amount of data can become overwhelming, often leading to complex dashboards, information overload, and analysis paralysis.
Now, imagine you had a dedicated tool to tackle this problem.
With Exolyt - TikTok Analytics and Social Intelligence, you can not only boost your social monitoring and listening capabilities but also get access to a unique performance metric that helps to benchmark your social standing.
This metric is called the Exo Score and it has been introduced by the Exolyt data science team, after thorough analysis of many relevant social factors, so you don't need to measure yourself!
What is Exo Score by Exolyt?
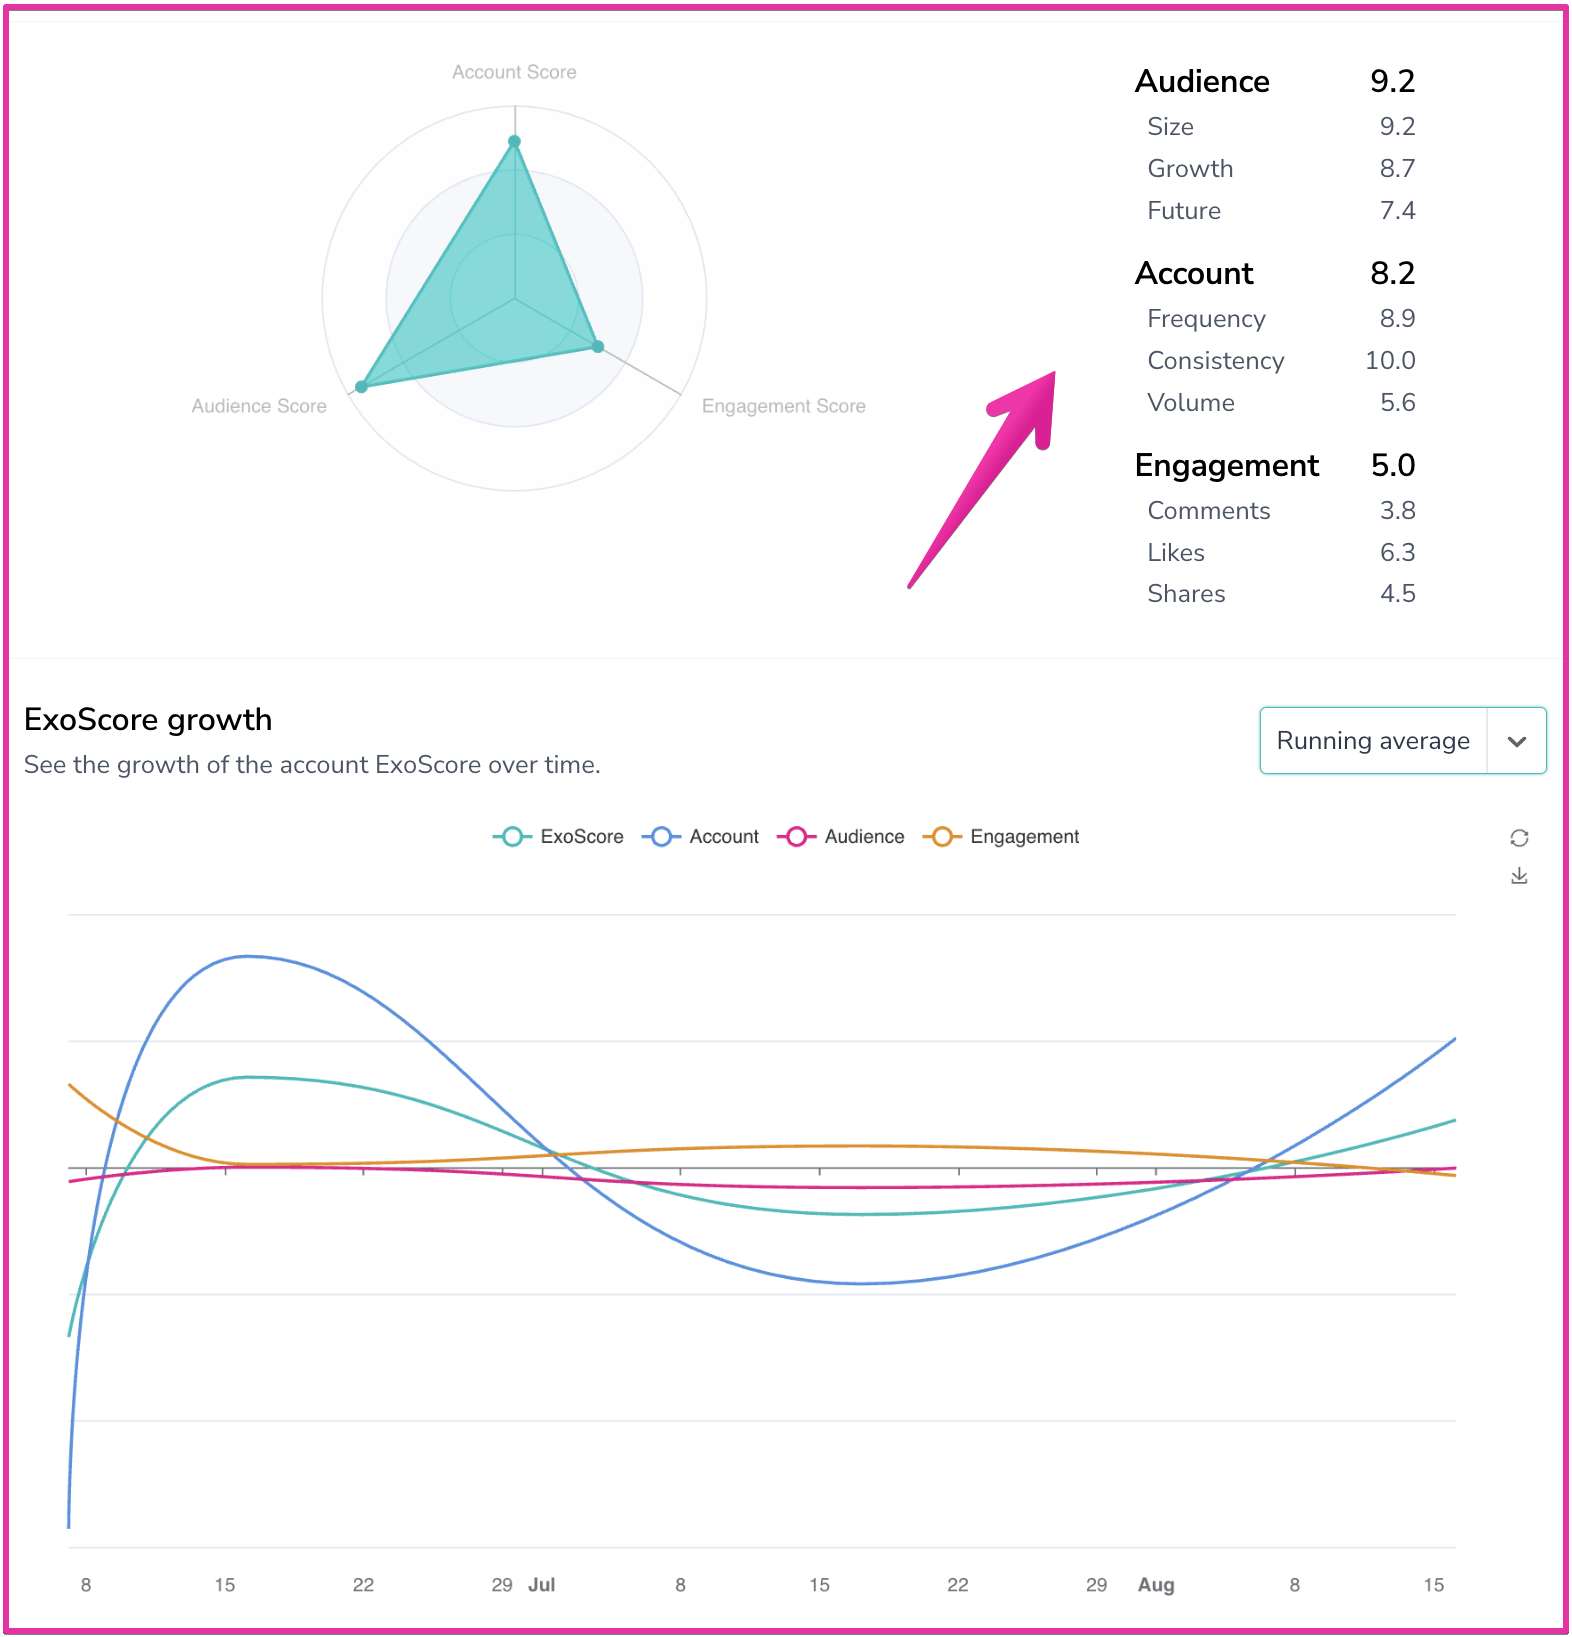
Exo Score is a system for summarising a wide range of account metrics into a single chart that efficiently communicates all crucial account information at a glance.
It enables Exolyt users to see a high-level summary of key account information and evaluate its performance relative to all other accounts.
How is Exo Score different from all other scores and metrics?
Like many other performance metrics, the Exo Score summarizes information about a given account. However, as it often happens, two accounts can end up having the same score but for very different reasons.
This is where Exo Score shines! It allows the viewer to see how different aspects of the account contributed to the overall account score.
Since no two TikTok accounts are the same, Exo Score’s snowflake chart breaks down each score into its underlying dimensions, creating a unique representation for each account.
Viewers can now quickly see how different characteristics of the account contributed to the overall score. Therefore, Exo Score not only tells you that account A has a higher score than account B but also allows the viewer to understand why.
How is the Exo Score calculated?
Exo Score is a relative metric, meaning that scores are assigned based on comparing a given account to other accounts on the platform. Each Exo Score combines three main characteristics of each account: Account Score, Audience Score, and Engagement Score.
- Account score tells the viewer how active the account is on TikTok relative to all other users. How frequently and consistently does the given account post? How much content has the account created relative to all other users? This helps to understand the vitality and commitment of the account.
- Audience Score tells the viewer about the current size, recent growth, and future growth potential of the account relative to all other TikTok accounts. This helps to identify young and high-growth potential accounts and large and slow-growing accounts.
- Engagement Score tells the viewer about the vitality of the audience. It separately compares how likes, comments, and shares of the given account compare to all other accounts and combines all three into a border engagement score.
These three characteristics give an additional flavour to the account comparison. For example, a viewer can compare that account A has a higher audience score than account B but a lower engagement score than account B. Since, every company has specialized needs and interests these differences allow companies to identify the right match for their needs at a glance.
(This hierarchical structure of ExoScore allows Exolyt’s data science team to capture a very large number of KPIs, group them together and summarise them with a single score while still allowing the viewer to see score breakdowns at each level).
What are some of the benefits of using Exo Score?
1. High-Level Account Overview & Comparison at a Glance:
- Exo Score offers users a fast and comprehensive overview of the TikTok account - Instead of sifting through extensive data, users can get a snapshot of the account's performance (a social benchmark powered by Exolyt's unique analysis).
- This high-level view is invaluable for users who want a quick understanding of their (or any account's) TikTok presence without delving into complex analytics.
- This feature is particularly useful for businesses and influencers managing or analyzing multiple TikTok accounts or tracking the competition.
3. Provides a Common Baseline for Comparing Different Accounts:
- Exo Score creates a single benchmark where a wide range of accounts can be compared on an apples-to-apples basis.
- It standardizes the evaluation process, ensuring users assess accounts using the same criteria.
- This consistency is essential for fair and accurate comparisons, whether personal account growth tracking or benchmarking against competitors.
4. Transparent Scoring That Shows Score Breakdown:
- Exolyt's Exo Score offers a transparent scoring system that breaks down multiple factors contributing to this unique metric.
- Users can precisely visualize how their account is evaluated, including metrics such as engagement, follower growth, content quality, and more.
- This transparency helps users understand their strengths and weaknesses and guides them in making data-driven improvements.
Examples of Exo Scores from Exolyt ft. @adidas & @nike
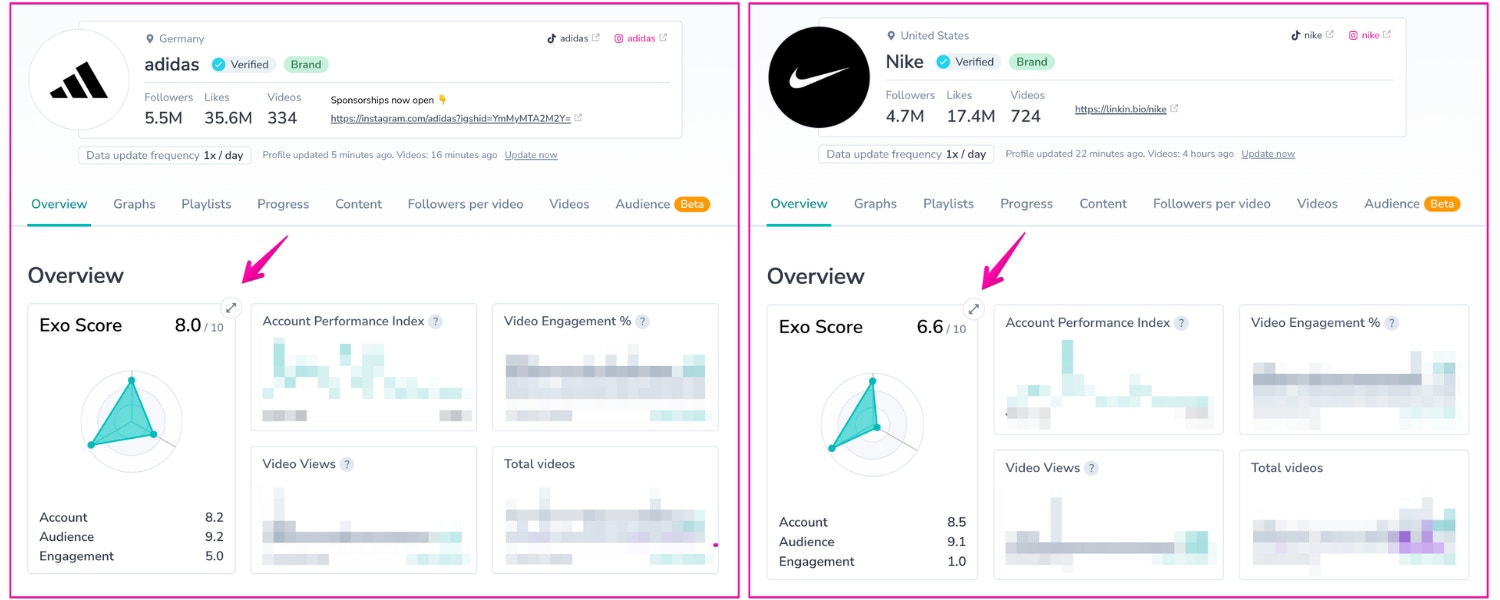
To better understand Exo Score's effectiveness, let's compare two competing brands from the same industry - Adidas and Nike - and see how Exo Score enables us to compare them quickly.
Right off the bat, we can see that the Exo Score for Adidas is 8.0, while for Nike, it’s 6.6, meaning there are noticeable differences in performance between the accounts.
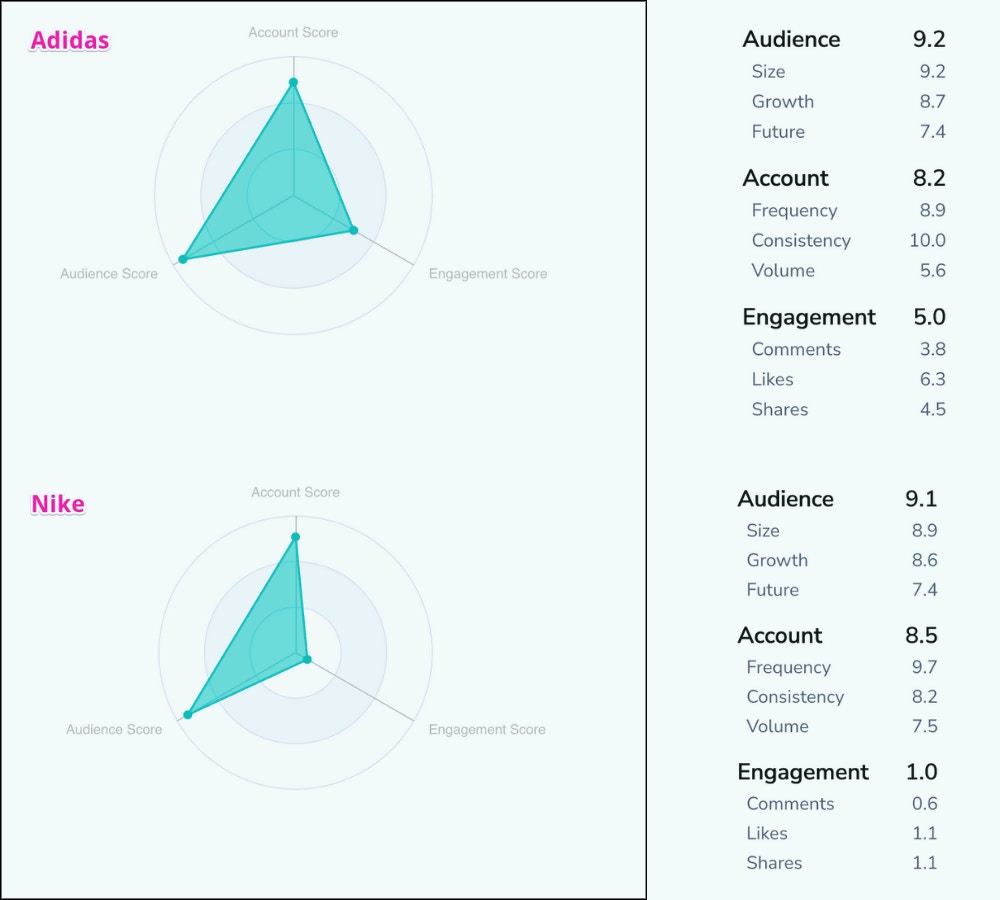
Furthermore, the Exo Score breakdown illustrates that most of the difference in the scores comes from the differences in the Engagement Score.
Despite having comparable audience Scores, Adidas has an engagement score of 5.0, while Nike has only 1.0.
In the detailed engagement score breakdown, we can see that
- Adidas' comments score is 3.8, while Nike's is 0.6, and
- The likes and share score for Adidas is 6.3 and 4.5, respectively, while Nike only scores 1.1 and 1.1.
This indicates that Adidas’s content is approximately six times more effective in engaging its audience.
- If we also look at the Account Scores for each account, we can notice that Nike is slightly ahead of Adidas, in posting frequency scores. However, it is still behind when we compare posting consistency scores.
This, combined with the engagement scores discussed above, illustrates the following:
Adidas's tactics of posting fewer videos consistently and less frequently resulted in better engagement rates than Nike's strategy of saturating the account with a lot of content but with less consistency.
The beauty of Exo Score is that all these observations were made without a need to move between tabs and look for various complicated statistical metrics. It provided a simple way to evaluate accounts and form a high-level understanding of account differences.